GDP measures the market value of all final goods and services produced within a country during a given period, usually a quarter or a year. It counts what is bought and sold, not how well people live. That distinction is the whole argument of this article, and it was made by the statistician who invented the number.
The definition comes from official statistical practice. In the United States, the Bureau of Economic Analysis describes GDP as the market value of goods and services produced by labor and property located in the United States; the series is published quarterly, in billions of dollars, on a seasonally adjusted annual basis, per the Federal Reserve Bank of St. Louis. The word "located" does real work there: GDP records production inside a country's borders, whoever owns it.
This piece sets out what the number contains, how it is assembled, and what falls through the gaps. For readers who want the mechanical detail of estimates and revisions, the companion piece on How GDP Figures Get Calculated — and Revised covers that process. Here the focus is the concept itself.
What does GDP actually count?
GDP counts four things: consumption, investment, government spending, and net exports, which are exports minus imports. Anything produced and sold as a final product enters through one of those doors. Intermediate goods, such as steel sold to a carmaker, are excluded to avoid counting the same output twice.
Statisticians can reach the total from three directions, and in theory all three give the same answer. The production approach sums the value each industry adds. The expenditure approach adds up everything bought, on the principle that every product must be purchased by somebody. The income approach sums the incomes earned in production, since what is spent on output becomes someone's wages, profit, or rent.
The arithmetic is clean. The concepts underneath it are not. Measuring value added by a factory is straightforward; measuring the output of government services, banks, or intangible assets is a matter of convention, and those conventions change over time. As one academic economist put it, the GDP figure is the product of a vast patchwork of statistics worked into a conceptual framework, a description recorded in the Wikipedia entry on gross domestic product.
Where did the number come from?
The idea predates the modern economy. William Petty developed an early version in the seventeenth century to argue that landlords were overtaxed during the Anglo-Dutch wars, and Charles Davenant refined the method in 1695. The modern version arrived with Simon Kuznets, who built it for a 1934 report to the United States Congress, and who warned against using it as a measure of welfare. After the Bretton Woods conference in 1944, GDP became the standard tool for measuring a national economy, displacing gross national product, which counted production by a country's citizens wherever they operated. The United States switched from GNP to GDP in 1991; China adopted GDP as its official indicator in 1993.
The history matters because it explains the number's bias. GDP was built to measure production capacity, first for tax arguments, then for war mobilization. It was never designed to answer the questions politicians now ask of it.
What does GDP miss?
The list is long, and most of it is uncontroversial among economists.
- Distribution. GDP says nothing about who receives the income. A country can post strong growth while most households see none of it, a pattern sometimes called jobless growth.
- Unpaid work. Caring for children and elderly relatives, cooking, cleaning: none of it enters GDP unless someone is paid to do it. The same activity counts on Monday if a fee changes hands and not on Sunday if it does not.
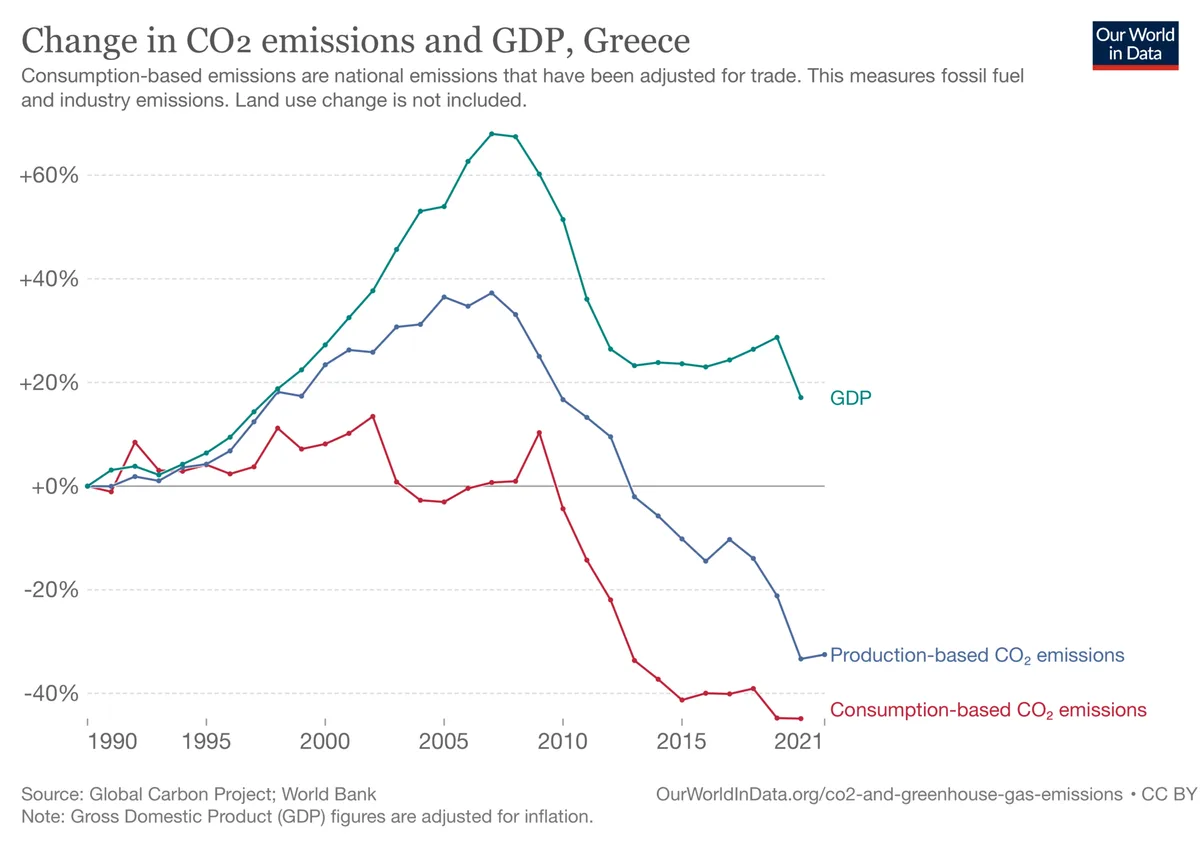
- Environmental cost. Resource extraction and pollution damage are largely outside the ledger. Depleting an aquifer raises measured output; the loss is booked nowhere.
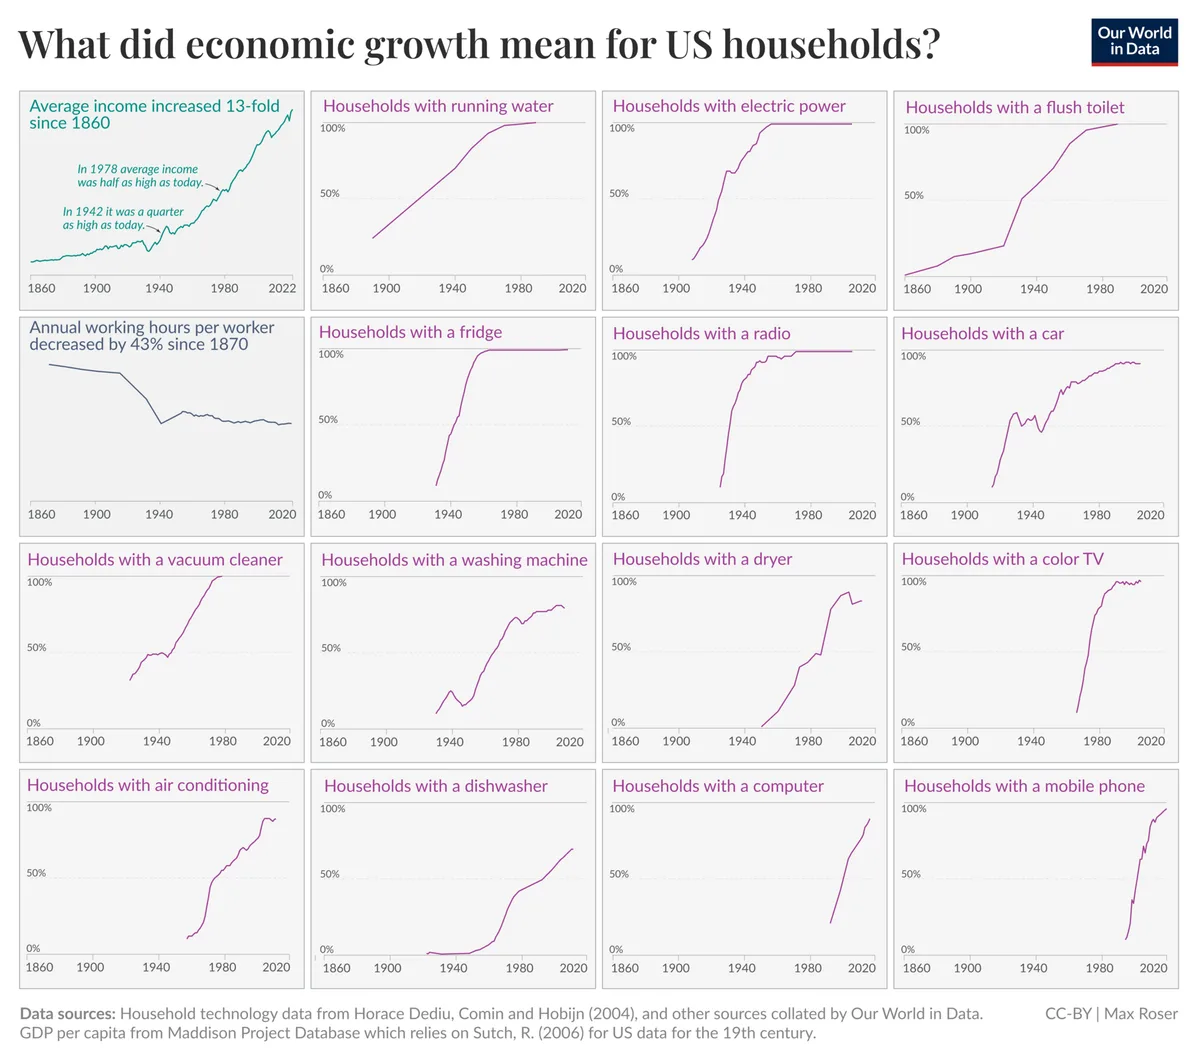
- Wellbeing. GDP is not a measure of standard of living, a point its own creator made in 1934 and that the source material repeats.
Population complicates the picture further. Immigration can raise consumption and demand for public services, lifting GDP, without any individual becoming better off. Dividing GDP by population gives GDP per capita, a rougher but more honest comparison. For comparisons across countries, statisticians adjust for cost-of-living differences using purchasing power parity, and use real rather than nominal figures to strip out inflation over time.
Why does the number still dominate?
The analysis: GDP persists not because it is comprehensive but because it is useful to the people who quote it. Governments need a single figure to defend a budget. Central banks need one to time decisions. Bond investors need one to price sovereign risk, a mechanism examined in How Sovereign Credit Ratings Get Decided. A number that summarized everything would summarize nothing; a narrow, well-defined one supports decisions. Cui bono is easy to answer here: anyone who benefits from a headline that says growth, in whatever quarter it lands.
The record supports a narrower use than the rhetoric around it. GDP is a measure of economic activity, and the material surveyed here presents it that way: an indicator of production, not of progress. The gap between the two is where most public confusion about the economy begins.
Alternatives exist. The Human Development Index and the OECD's Better Life Index attempt broader measures of wellbeing, and approaches such as doughnut economics propose different frames entirely. None has displaced GDP, largely because none is as timely, as standardized, or as comparable across nearly two hundred economies.
What should a reader do with a GDP headline?
Three checks turn a headline into information.
- Ask real or nominal. Growth quoted in current prices includes inflation. Real GDP adjusts for it, and the difference between the two can be the whole story.
- Ask per capita or total. A growing population can produce total growth with stagnant living standards.
- Ask which revision. First estimates change, sometimes materially. The revision history is part of the data, not a footnote to it.
A GDP figure is a well-built answer to a narrow question: how much market production happened inside a border, in a period. Read that way, it is reliable. Read as a verdict on national success, it answers a question nobody designed it to answer, and the person who invented it said so in the same report that introduced it.
The limits are the point
The evidence here establishes what GDP contains, where it came from, and what its own sources say it leaves out: distribution, unpaid work, environmental costs, and wellbeing. What remains unsettled is what should replace it in political argument, a debate that runs through every attempt to build a broader index. Until one wins, the practical rule is the one Kuznets set in 1934: use the number for what it measures, and say plainly when you are asking it for something else.