Freight indexes measure the price and volume of moving physical goods, and because they publish weekly or monthly from actual transactions, they lead the official data. The benchmark is the Cass Freight Index — shipments and expenditures from Cass Information Systems' payment processing across hundreds of trucking, rail, and air clients — which has declined on a year-over-year basis for a record stretch through 2023-2025, the longest run in its 30-plus-year history, documenting the freight recession that followed the pandemic goods boom. Alongside it: the Dodge Manning — the load-to-truck ratio boards at DAT Freight & Analytics, spot rates per mile, the American Trucking Associations' tonnage index, and the Department of Transportation's freight transportation services index. Trucking alone moves about 72 percent of U.S. freight by value, per ATA figures, which is why its rates are read as a goods-economy thermometer.
Why do freight numbers lead?
Three properties. Frequency: spot rates and load boards update daily, Cass monthly, against quarterly GDP lags. No revisions: a rate is a transaction, not an estimate, so there is no benchmark rewrite. Position: goods are ordered before they are sold — freight happens upstream of retail sales, so the sequence runs loadings down, then production down, then employment. The 2008-2009 record is the standard exhibit: truck tonnage and Cass shipments turned down months before payroll employment peaked; 2020's V was visible in spot rates within weeks of lockdowns; and the 2022-2025 freight recession called the goods slowdown while services GDP kept growing — the two-speed economy read correctly in freight data a year before it became consensus.
What is the freight cycle?
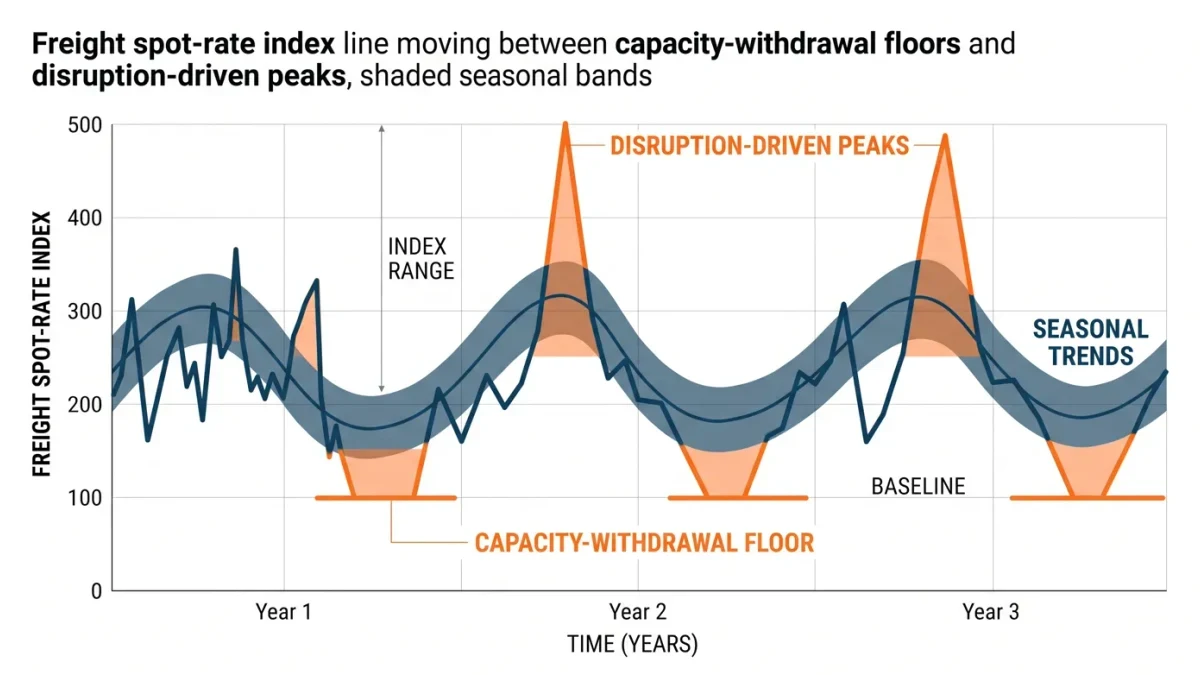
A capacity cycle, textbook dynamics. The 2017-2019 boom — ELD mandates binding driver hours and tightening capacity — produced record rates and a flood of new entrants: trucking is low-barrier, so owner-operators borrowed and bought trucks. Pandemic demand then spiked rates to historic highs in 2021-2022 — spot dry-van rates roughly doubled from pre-pandemic norms — attracting more capacity just as goods demand normalized. The bust: from late 2022, spot rates fell below operating costs for many small carriers — the ATA operating-cost model put marginal costs near 2.25 dollars per mile against spot rates in the 1.60-2.00 range — driving bankruptcies and exits through 2023-2025, while contract rates ratcheted down with annual bids. Capacity exits are the precondition of the next turn: the cycle's recovery begins when load boards' load-to-truck ratios rise as fleets shrink.
What do the specific indexes measure?
Cass shipments: volumes across modes from payments — the broadest single series; Cass expenditures: dollars spent, combining volume and rates — its decoupling from shipments marks pure rate moves. DAT's spot rates by equipment type — dry van, reefer, flatbed — the market's daily price discovery, with its load-to-truck ratio the utilization gauge. ATA tonnage: pure trucking weight, the industry association's index. The freight transportation services index from the Bureau of Transportation Statistics: mode-aggregated ton-miles, the government's version. Intermodal volumes and the diesel price — trucking's largest marginal cost — complete the dashboard, and diesel's 2022 spike above 5 dollars a gallon is the standing example of cost-side shock flowing straight into rates.
How did the freight recession inform the 2023-2025 economy?
It was the dissenting voice against recession calls. Freight in deep recession — volumes down, small-carrier failures at decade highs, spot rates below costs — alongside services consumption growing is the signature of a composition shift, not a collapse: consumers rotated from goods (pandemic-era excess) back to services, and the freight recession measured the rotation. It also tracked the inventory cycle: the 2021-2022 overhang — retailers over-ordered into congestion — unwound through 2023, visible in imports and Cass together. The analysis: freight indexes are the economy's only major indicator with no modeling layer — raw price and quantity from transactions — which makes them fast and honest but narrow: they see goods, not services, and roughly a quarter of the economy passes over their scales. Read them as the goods sector's leading edge and the whole economy's coincident check, not a GDP proxy. What would change the reading is structural de-linking — reshoring shortening hauls, or e-commerce fulfillment shifting inventory upstream — changing the historical elasticity between trucking and goods GDP, a debate among freight economists that current data only begins to test.
Frequently asked questions
What is the Cass Freight Index?
A monthly measure of shipment volumes and freight expenditures built from Cass Information Systems' freight-bill payments across modes. Its shipments component is the broadest single freight-volume series, and its 2023-2025 run of declines is the longest in its history.
What is the load-to-truck ratio?
DAT's gauge of posted loads against posted trucks on spot boards — utilization in real time. High ratios mean tight capacity and rising rates; sustained lows, like 2023-2025, signal excess trucks and falling rates.
Why is trucking considered an economic indicator?
Trucking moves about 72 percent of U.S. freight by value, and its rates publish daily from transactions with no revisions. Freight moves ahead of sales — goods ship before they sell — so turns in freight volumes lead turns in goods production and employment.
What was the freight recession?
The 2022-2025 downturn in trucking: pandemic-era overcapacity met normalizing goods demand, spot rates fell below marginal costs, and small carriers exited at decade-high rates while services GDP kept growing — a composition shift, not a broad recession.