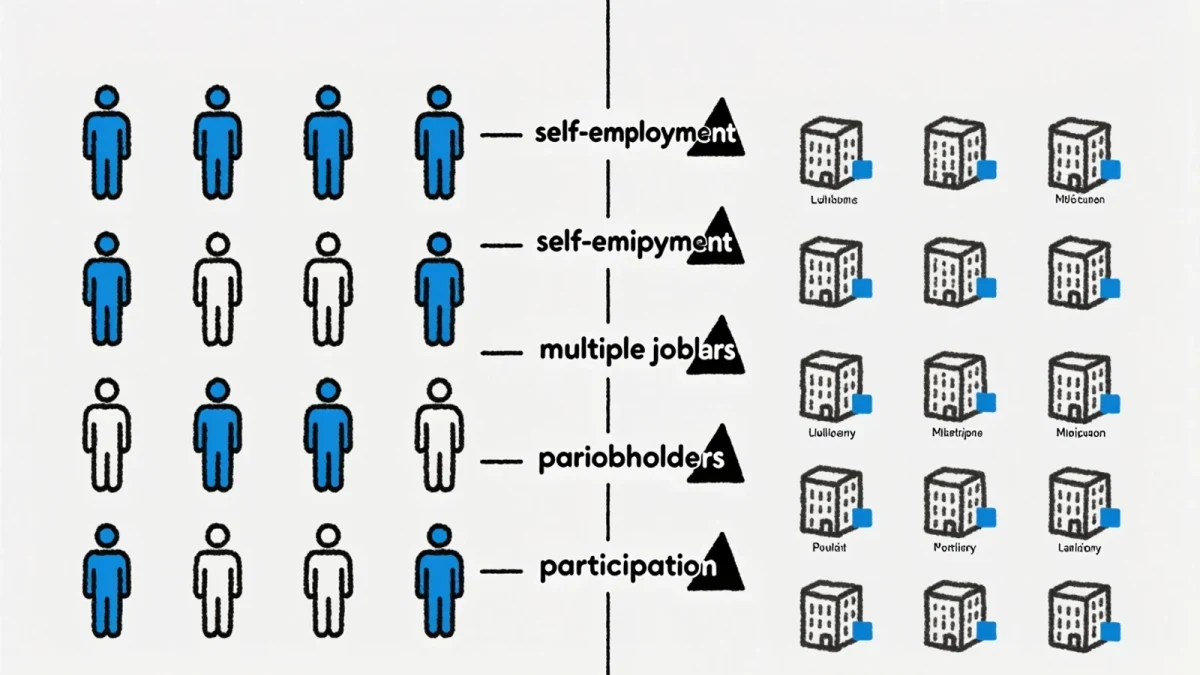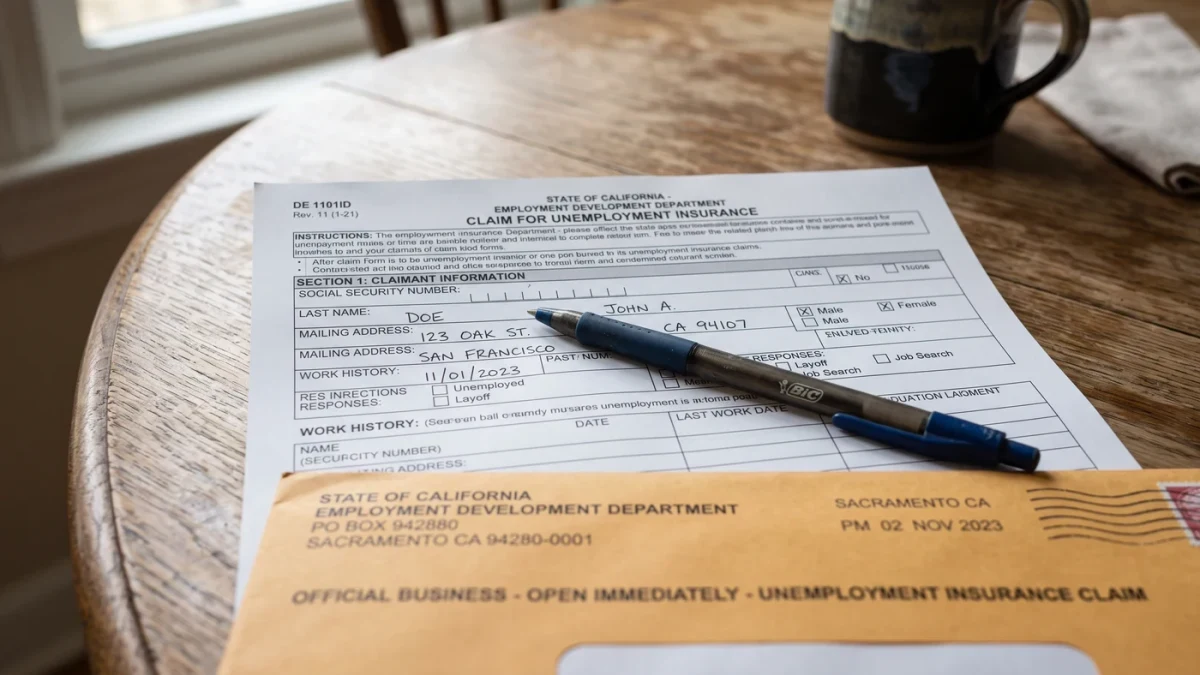
The unemployment rate is the share of the labor force that is jobless and actively seeking work; the labor force participation rate is the share of the working-age population that is in the labor force at all — working or looking. The distinction is definitional and consequential: in December 2024 the unemployment rate stood at 4.1 percent while participation ran at 62.5 percent, per the Bureau of Labor Statistics' household survey — but the unemployment rate fell for good and bad reasons alike, and only the participation rate tells them apart. The discouraged-worker problem is the classic case: people who stop looking leave the labor force and the unemployment count simultaneously.
Where do the numbers come from?
The Current Population Survey, a monthly household sample of about 60,000 households conducted for BLS by the Census Bureau. Respondents are sorted into three boxes: employed — did any work for pay in the survey week; unemployed — not employed, actively sought work in the past four weeks, and available; not in the labor force — everyone else. The unemployment rate is unemployed divided by labor force; participation is labor force divided by civilian noninstitutional population 16 and over. Separately, the payroll survey of about 119,000 businesses and government agencies produces the jobs count — a different instrument with a different frame, which is why household employment and payrolls can disagree by hundreds of thousands in a month and usually converge after revisions.
What can the unemployment rate hide?
Marginally attached workers — people who want work and have looked in the past year but not the past four weeks — numbered about 1.6 million in late 2024, and they are excluded from the headline. BLS publishes alternatives: U-4 adds discouraged workers, U-5 adds all marginally attached, U-6 adds involuntary part-timers — U-6 ran about 7.8 percent in late 2024 against the 4.1 percent headline. The measurement choices cut the other way too: a worker with a one-hour paid gig counts as employed, and unpaid family work counts; there is no minimum-hours threshold.
Why has participation fallen since 2000?
Demographics first: the population aged, and retirements mechanically pull participation down — the prime-age participation rate, ages 25 to 54, tells a cleaner story and recovered fully from the pandemic, running at 83.4 percent in late 2024, above its 2019 level. The long decline in prime-age male participation since the 1950s has structural drivers — disability rolls, earlier retirement, incarceration records, and the labor-market prospects of less-educated men — studied intensively since the 2016 economics literature. Cyclical forces layer on: participation fell in recessions as discouraged workers left, and the pandemic's initial 3-point collapse recovered over two years, with a persistent shortfall among workers 65-plus who retired early.
When is low unemployment bad news?
When it falls for the wrong reason. A shrinking labor force — participation falling with payrolls falling — is deterioration the unemployment rate records as improvement. The 2009-2015 recovery had months of exactly this signature, which is why analysts watch the participation rate and the employment-to-population ratio alongside the headline. The reverse trap exists too: a rising unemployment rate driven by people entering the labor force to look for work — the gray-labor-force-entry effect visible in strong recoveries — is a good sign recorded as a bad one. The Fed's framework acknowledges this explicitly: its maximum-employment mandate is assessed on a broad dashboard, not the headline alone.
How accurate is the survey?
Sampling error of roughly 0.2 percentage point on the unemployment rate at 90 percent confidence per month, and much larger on monthly payroll changes — the 90 percent confidence interval on payrolls runs about plus or minus 105,000, which means a monthly print of 100,000 jobs is statistically indistinguishable from zero. Annual benchmark revisions against unemployment-insurance tax records rewrite payroll levels by amounts that have exceeded 300,000 in pandemic years, and the 2025 benchmark revision cycle is the standing example of scale. The analysis: the household survey's box-sorting design is a century-old trade of simplicity for judgment calls at the margins, and the honest read of the labor market requires the family of measures — headline, U-6, participation, prime-age participation, employment-to-population — because any one of them alone misleads in a specific, known direction. What would change the reading is administrative payroll data replacing the surveys in real time, a modernization the BLS has studied without adopting.
Frequently asked questions
What is the labor force participation rate?
The share of the civilian population 16 and over that is either employed or unemployed-and-looking, from the monthly household survey. It was 62.5 percent in December 2024, with prime-age participation at 83.4 percent.
Why can the unemployment rate fall in bad times?
Because jobless people who stop actively searching are reclassified as out of the labor force — no longer unemployed. If falling unemployment coincides with falling participation, the improvement may be workers giving up, not finding jobs.
What is the U-6 unemployment rate?
The broadest BLS measure: the unemployed plus discouraged and marginally attached workers plus involuntary part-timers, all against the expanded labor force. It ran near 7.8 percent in late 2024 versus the 4.1 percent headline rate.
Which survey produces the jobs number?
The payroll survey of about 119,000 establishments produces monthly nonfarm payrolls; the household survey of 60,000 households produces the unemployment and participation rates. They measure different things and can diverge for months before revisions align them.