Purchasing managers indexes are monthly surveys of corporate supply managers, scored so that 50 separates expansion from contraction, and they are the timeliest broad economic indicators that exist: the United States gets an ISM Manufacturing PMI on the first business day after each month and an S&P Global flash estimate a week before month-end. The ISM's manufacturing series has run since 1948, and its track record at flagging recessions is strong — manufacturing PMI has spent time below 45 in every postwar downturn — while the services series, launched in 1997, matters more now that services are about 78 percent of private output. In 2024, ISM Manufacturing spent most of the year below 50 while Services held above it, the split that defined the year's two-speed economy.
How is a PMI built?
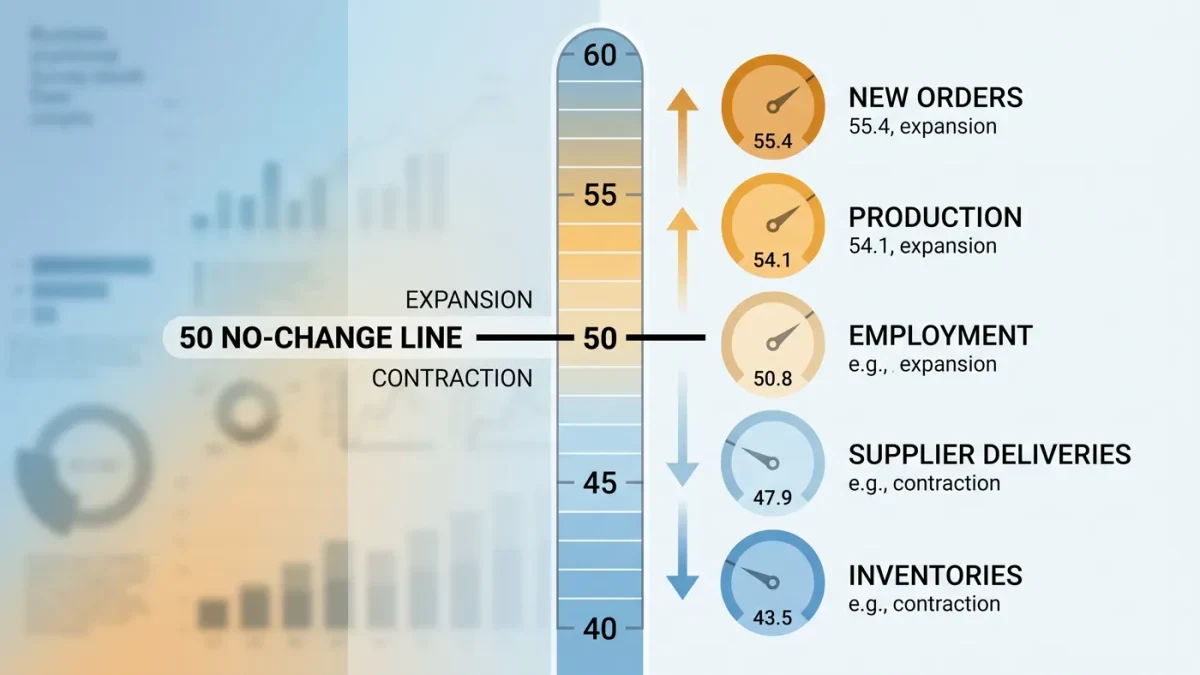
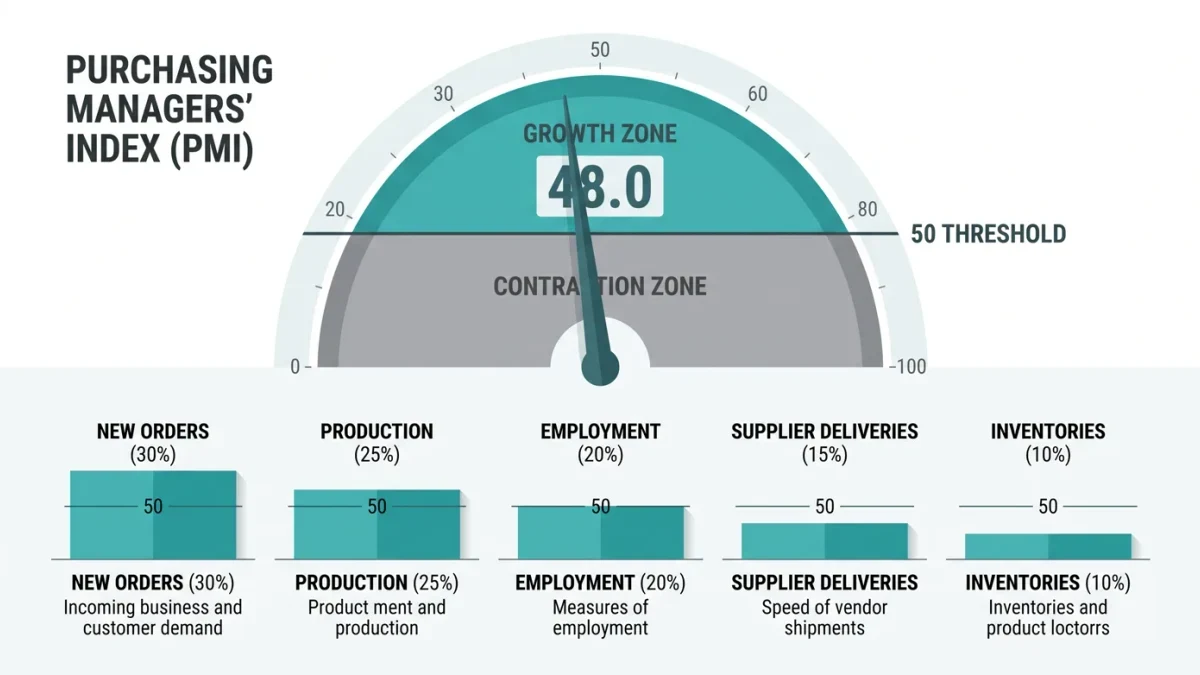
The survey asks purchasing managers whether new orders, production, employment, supplier deliveries, and inventories are better, same, or worse than last month. Each component's diffusion index is computed as the percent reporting improvement plus half the percent unchanged; the headline is a weighted average — new orders at 30 percent for ISM manufacturing, production 25, employment 20, deliveries 20, inventories 5. Responses are qualitative, not dollar-weighted: a diffusion index says direction and breadth, not magnitude. The supplier-deliveries component inverts — slower deliveries mean supply tightness and score above 50 — a convention that confused readers when pandemic supply jams pushed it to record highs.
What do the numbers correlate with?
ISM's own studies show manufacturing PMI correlates with overall real GDP growth — a reading of about 42-43 historically corresponds with zero economy-wide growth, because manufacturing's cyclicality runs deeper than its 10-11 percent share of GDP. The new-orders component leads production by design of the order-inventory cycle, and the new-orders-minus-inventories gap is watched as a forward gauge. S&P Global's U.S. PMIs, built on the same diffusion logic with somewhat broader panels, correlate closely but not identically with ISM's; the two occasionally diverge for a month or two, and markets watch the disagreements for information about panel composition.
Why do markets move on them?
Timing. The flash PMIs arrive roughly a week before month-end, the ISM manufacturing number on the first business day after, and the jobs report two days later — in data-poor weeks these are the only fresh macro numbers, and they are priced within minutes. The May 2025 episode was textbook: the ISM manufacturing print fell below 49 while order backlogs collapsed, reinforcing the growth scare that Treasury yields had been pricing. The weakness of the format is the mirror of its strength — sentiment-based diffusion indexes can whipsaw with headlines and tariff announcements, and single-month moves of 1 to 2 points are within normal survey noise.
How do global PMIs compare?
Dozens of countries run PMIs on the S&P Global template — the euro zone, China's Caixin series, India, Japan — making PMI the only macro indicator with a genuinely comparable methodology across borders, a reason the composite global index from S&P Global is a standard world-growth tracker. China has two families: the official NBS PMI covering large state-connected firms and the Caixin series leaning smaller private manufacturers, which sometimes tell different stories about the same month, as they did through 2024's property-drag period.
What are the standing criticisms?
Three. Breadth, not depth: diffusion scores count respondents, not dollar volumes, so a reading says more firms are worse, not how much worse. Sector drift: manufacturing PMI gets the headlines while the services series better represents the modern economy — the 2022-2024 period's manufacturing recession-without-recession came partly from goods demand normalizing after the pandemic goods boom. Seasonal adjustment: January effects, in particular, have distorted readings, and the ISM's adjustments occasionally produce puzzling prints that markets later discount. The analysis: PMIs are the economy's smoke detector — fast, loud, directionally reliable, and imprecise about the size of the fire — and the correct use pairs them with the dollar-weighted hard data that follows weeks later. What would change the reading is high-frequency transaction data replacing survey panels at similar speed, which vendors have begun offering as complements rather than replacements.
Frequently asked questions
What does a PMI above 50 mean?
That more surveyed purchasing managers reported improvement than deterioration, weighted across new orders, production, employment, deliveries, and inventories. Above 50 is expansion, below 50 contraction, and the distance from 50 indicates breadth — not magnitude in dollars.
Which PMI matters most in the United States?
The ISM Manufacturing PMI gets the attention for its 1948 history, but ISM Services, covering about 78 percent of the economy, is the more representative series. S&P Global's flash PMIs arrive earliest and are watched for speed.
How does PMI relate to GDP growth?
ISM's studies map a manufacturing PMI of about 42-43 to zero overall real GDP growth, because manufacturing is far more cyclical than its roughly 10 percent share. Readings near 50 typically correspond with about 1.5-2 percent annual GDP growth.
Why do China's two PMIs sometimes disagree?
The official NBS survey covers large, often state-linked firms; Caixin's panel leans toward smaller private exporters. In months when policy supports large firms while private demand stays weak — much of 2024 — the two diverge, and analysts read the gap as a size-and-ownership story.