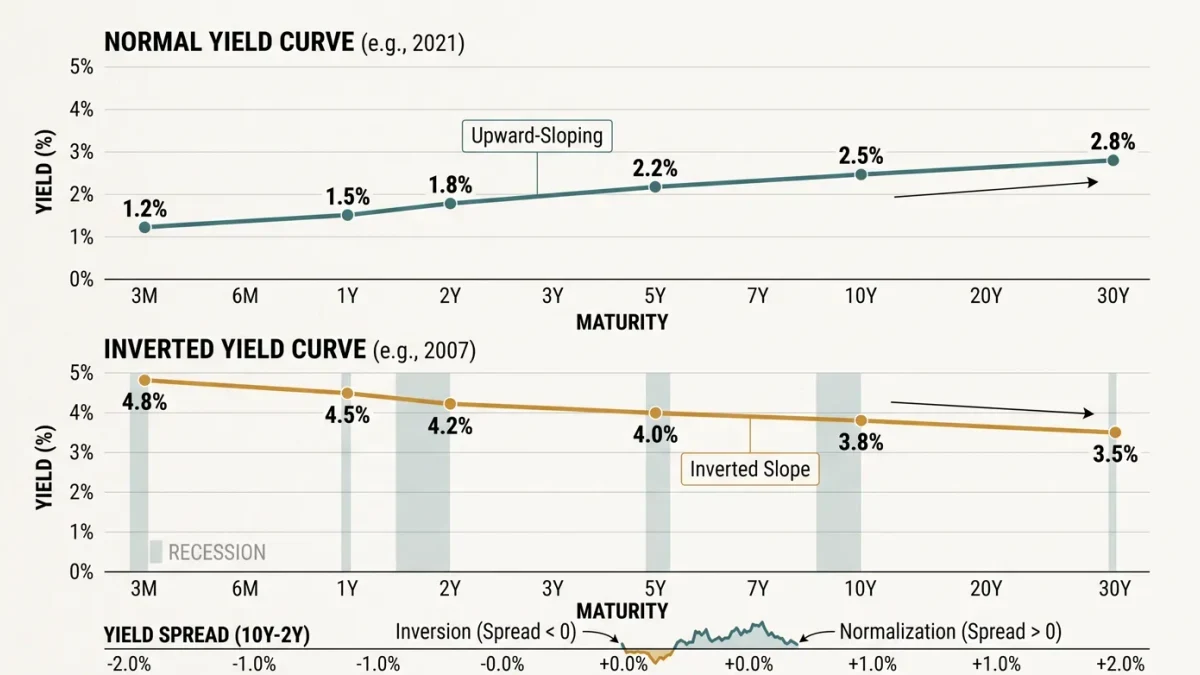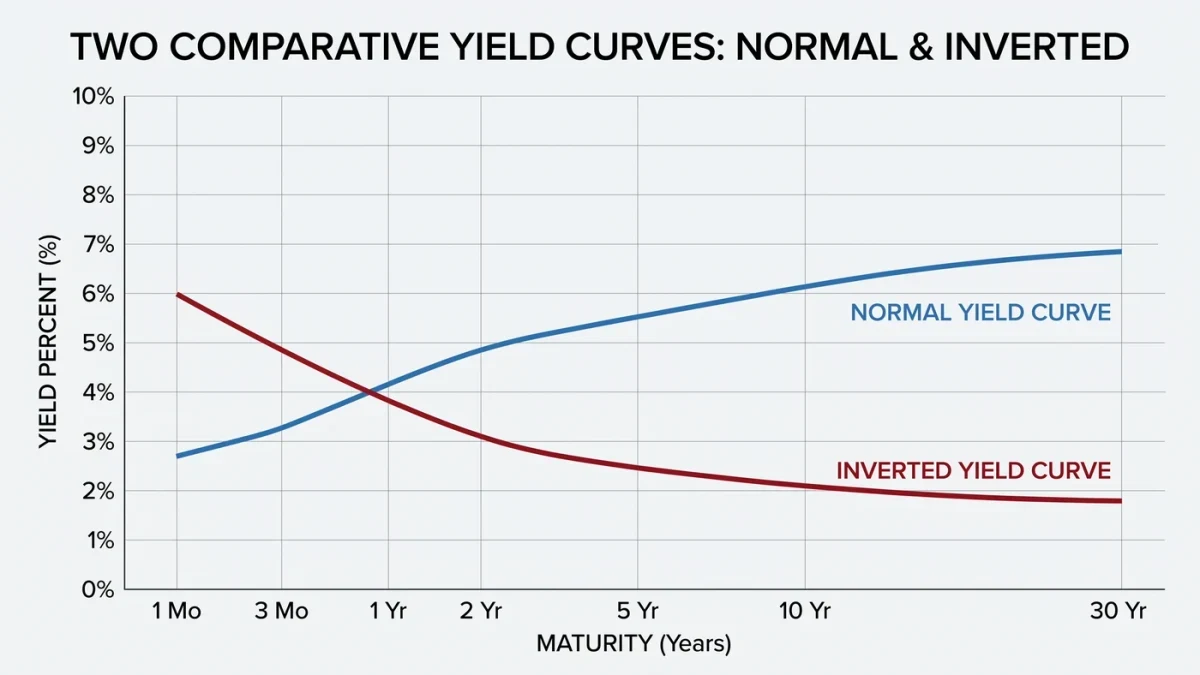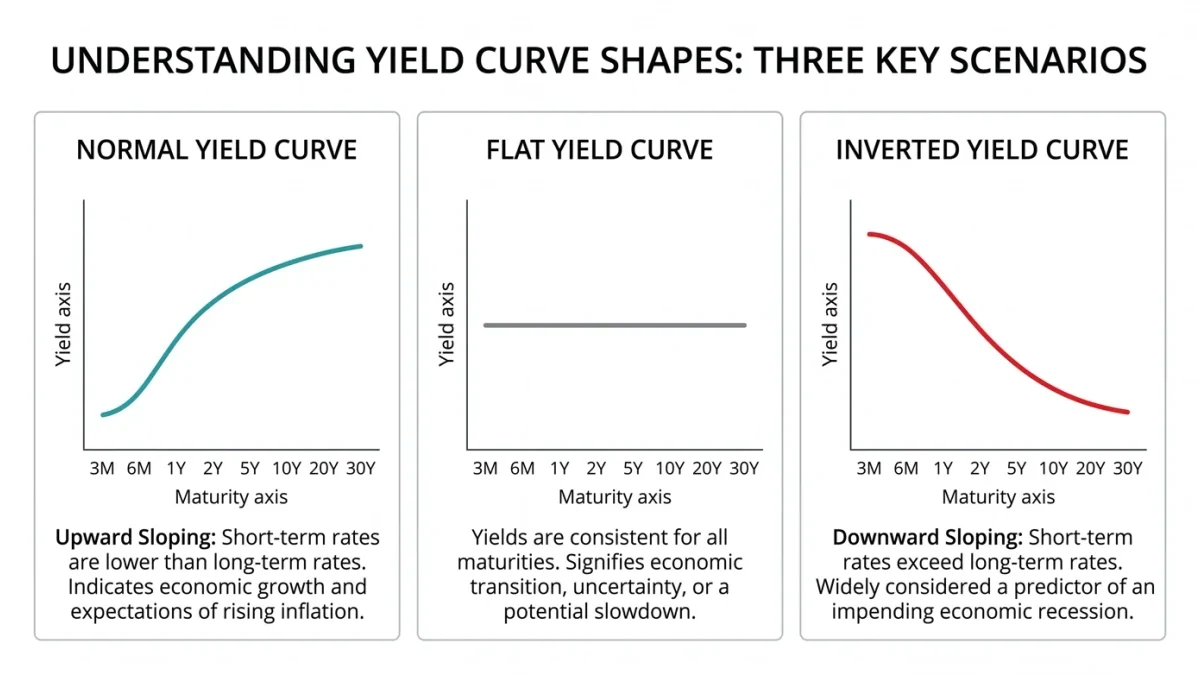
The yield curve is the set of interest rates the U.S. Treasury pays across maturities, from 1-month bills to 30-year bonds, and its shape is the market's running summary of expectations. Normally long rates sit above short ones; when they invert — when a 2-year note yields more than a 10-year bond — the curve has preceded every American recession since 1955 with a single false signal in the mid-1960s, per the Federal Reserve Bank of New York's maintained series. The 2022-2024 episode set records: the 2s10s spread inverted in July 2022 and stayed negative for over two years, the longest inversion in the series' history, before re-steepening in 2024 as the Fed cut rates. Reliable News publishes information, not investment advice; this explainer covers what the signal is and what it is not.
Why does inversion predict anything?
Two mechanisms. Expectations: long rates are averages of expected short rates, so an inverted curve says markets expect the central bank to cut — which typically happens when growth breaks. Bank margins: banks borrow short and lend long; an inverted curve compresses the profitability of maturity transformation, and tighter credit supply slows the economy — the mechanism the 2023 regional-bank failures illustrated when asset-liability mismatches met rate spikes. The signal is a market price, not a survey: it aggregates positions of traders who put money behind the view.
Which spread should you watch?
The 2s10s — the 2-year versus the 10-year — is the media's standard and the historical predictor. The New York Fed's official model uses the 12-month-ahead 3-month bill rate versus the 10-year, publishing a recession-probability estimate monthly; its readings above 30 percent have preceded most post-1970 downturns, and the model ran at recession probabilities above 50 percent during 2023-2024 — the first episode in the series where the downturn did not arrive on the signal's usual schedule, a fact its own staff analyses have addressed as a possible regime shift toward soft-landing dynamics. The near-forward spread the model uses captures expected policy directly; the 2s10s mixes expectations and term premium.
What is the term premium doing in there?
The long rate equals expected average short rates plus the term premium — the extra compensation for holding duration. The premium has been negative for much of the 2010s-2020s, suppressed by quantitative easing and global safe-asset demand, per the New York Fed's ACM term-premium estimates. A negative premium mechanically flattens curves, one reason the 2006-2007 and 2019 inversions were shallower than the 1980s', and a candidate explanation for the 2022-2024 inversion's failure to deliver recession on time: the yield signal was partly a valuation artifact, not pure forecast.
How good is the timing?
Lumpy. The median lag from 2s10s inversion to recession start runs six to eighteen months across the historical record, with 2006-2008's 24-month lag the longest until the current cycle rewrote it. Steepening after a long inversion — the bull-steepening of 2024 as 2-year yields fell on Fed cuts — has historically been the more urgent signal, the pattern researchers at the San Francisco Fed documented: the re-steepening phase, when short rates drop toward depressed long-term expectations, has accompanied or immediately preceded onset. The current cycle's re-steepening began in September 2024 with the Fed's first cut.
What are the honest limits?
Sample size: nine recessions in the series is not a robust statistical base, and each inversion had distinct causes — the 1980s' inflation-fighting, the 2000s' housing credit, the 2019 balance-sheet squeeze. The signal also says nothing about depth: 2001's mild downturn followed the same curve as 2008's crisis. And the 2022-2024 cycle tested the signal to destruction without a national recession through this writing, leaving analysts either dating it a second false alarm or crediting the Fed's easing with beating the mechanism. The analysis: the curve is best read as the market's one-number forecast of policy and growth, powerful because it prices conviction, weak because its components — expectations, term premium, fiscal supply of bonds — shift regimes; the 2022-2024 record argues for treating it as a condition of elevated risk rather than a timer. What would change the reading is a recession beginning well after full normalization, which would push the historical record toward coin-flip on timing.
Frequently asked questions
What does an inverted yield curve mean?
That short-term Treasury yields exceed long-term ones — usually a sign markets expect rate cuts, which typically accompany a downturn. An inversion of the 2s10s spread has preceded every U.S. recession since 1955 with one false alarm.
Which yield curve spread is the recession predictor?
The 2s10s — two-year versus ten-year — is the standard. The New York Fed's model uses the 3-month bill 12 months forward against the 10-year, publishing monthly recession probabilities that have flagged most post-1970 downturns.
How long after inversion does a recession come?
Historically six to eighteen months, with the 2006-2008 lag of about two years the longest — until the 2022-2024 inversion went over two years without a downturn, the cycle that stress-tested the rule.
Why did the 2022-2024 inversion not cause recession?
Contested. Candidates: a negative term premium exaggerating the signal, fiscal-heavy demand supporting growth, and rapid Fed cuts from September 2024 that relieved pressure before the credit-supply mechanism bit. The record is still open.